
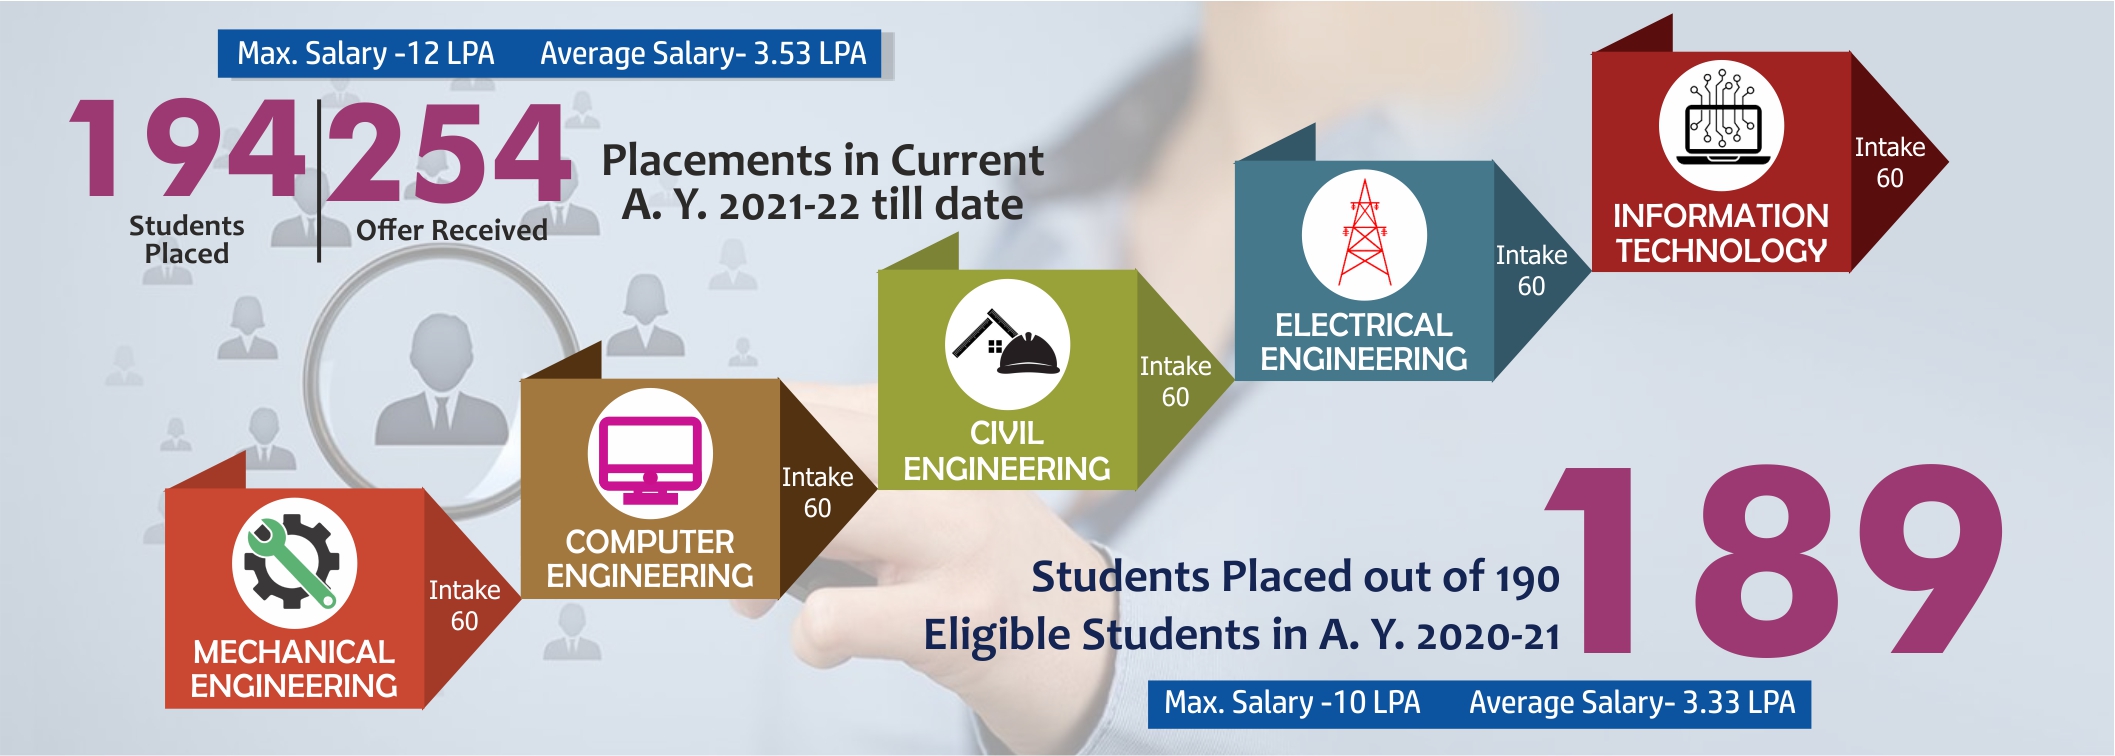
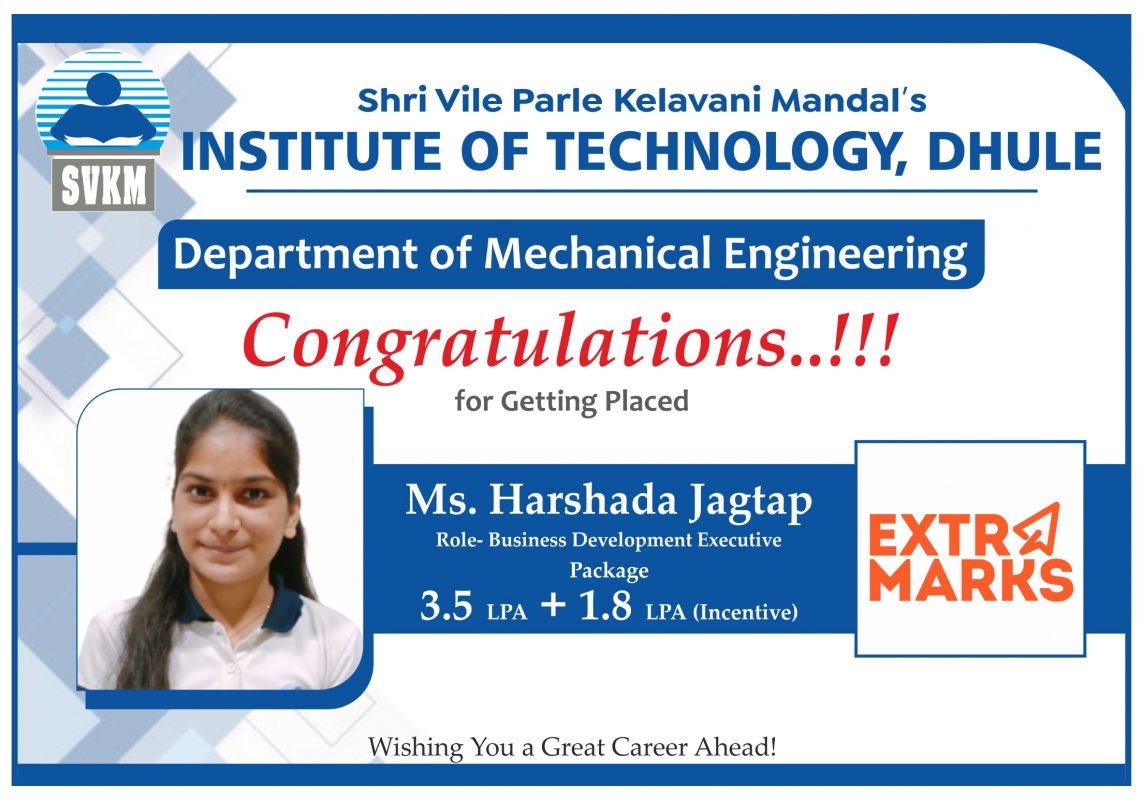
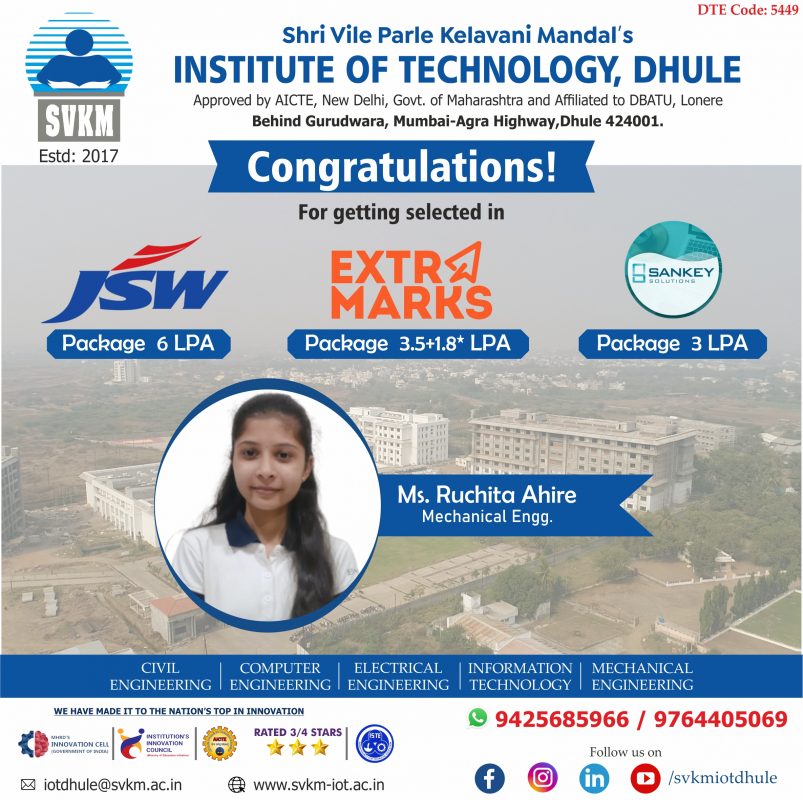
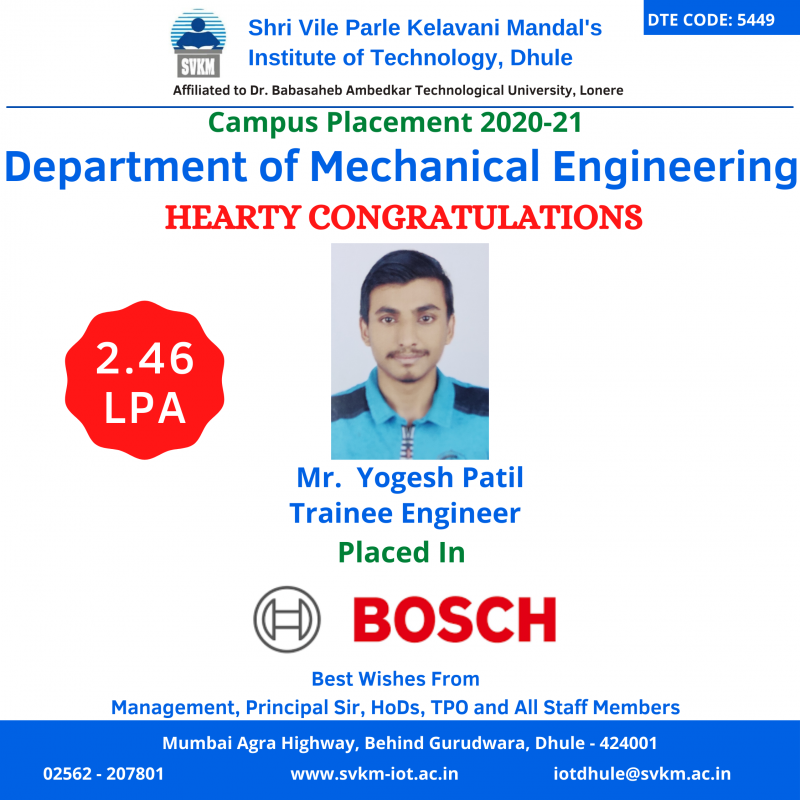
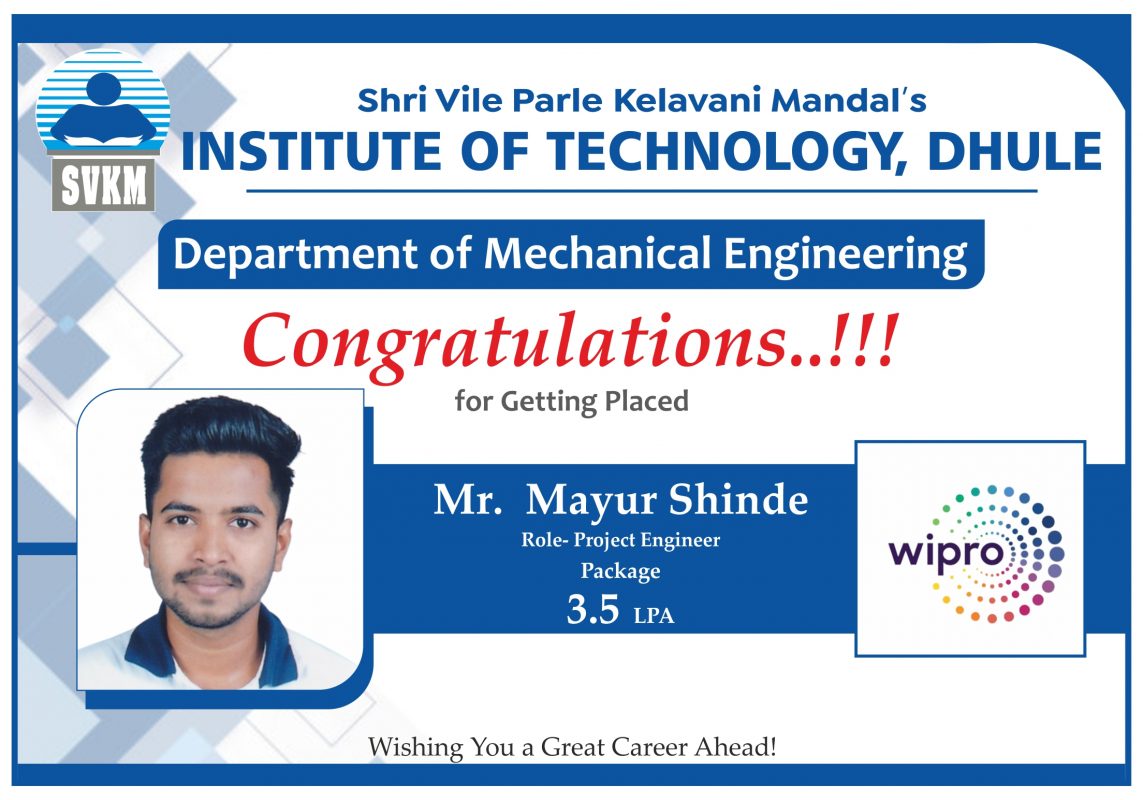
Mechanical Engineering Placement
The staff and faculty members from department taking efforts on students for all over students growth.
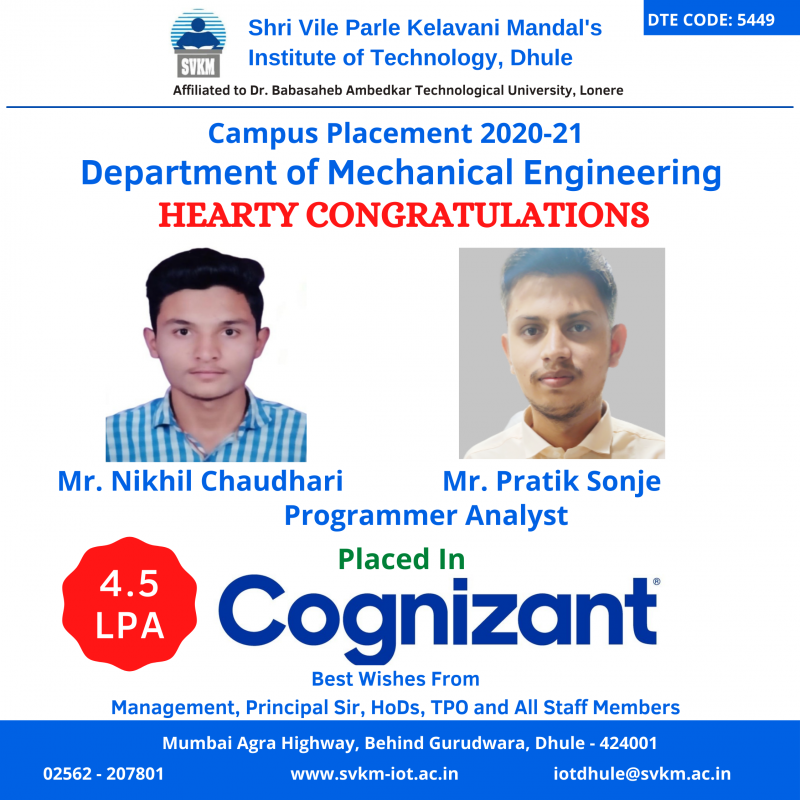
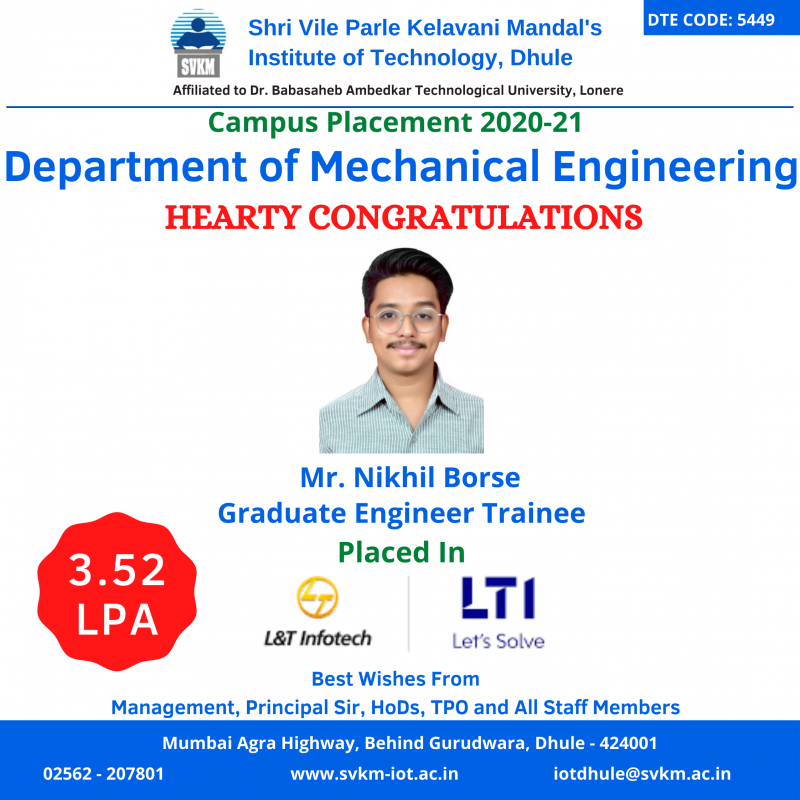
Mechanical Dept Placement Details_2021
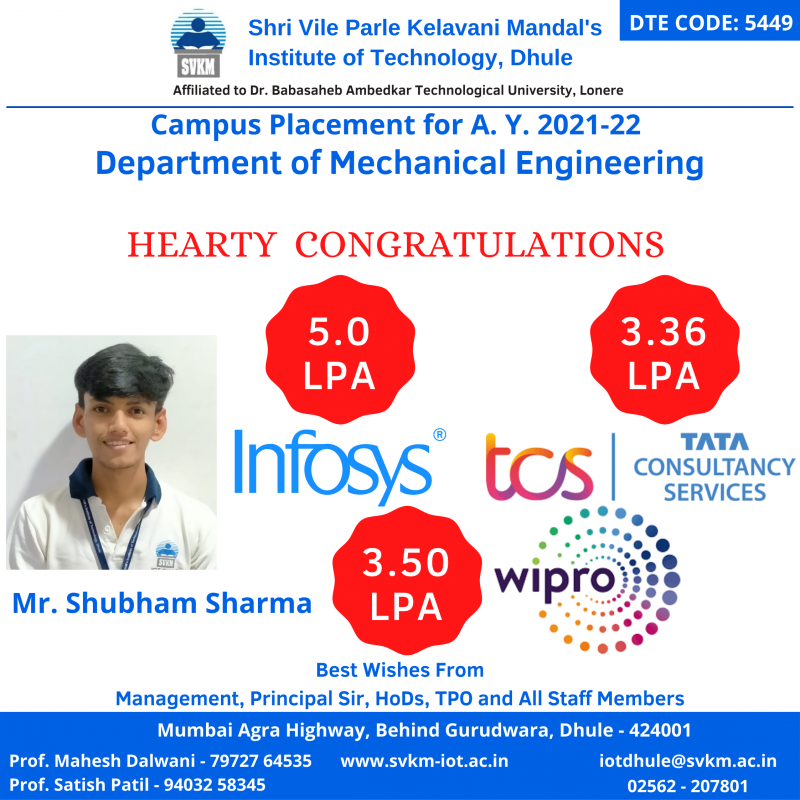
Mechanical Dept Placement Details_2022
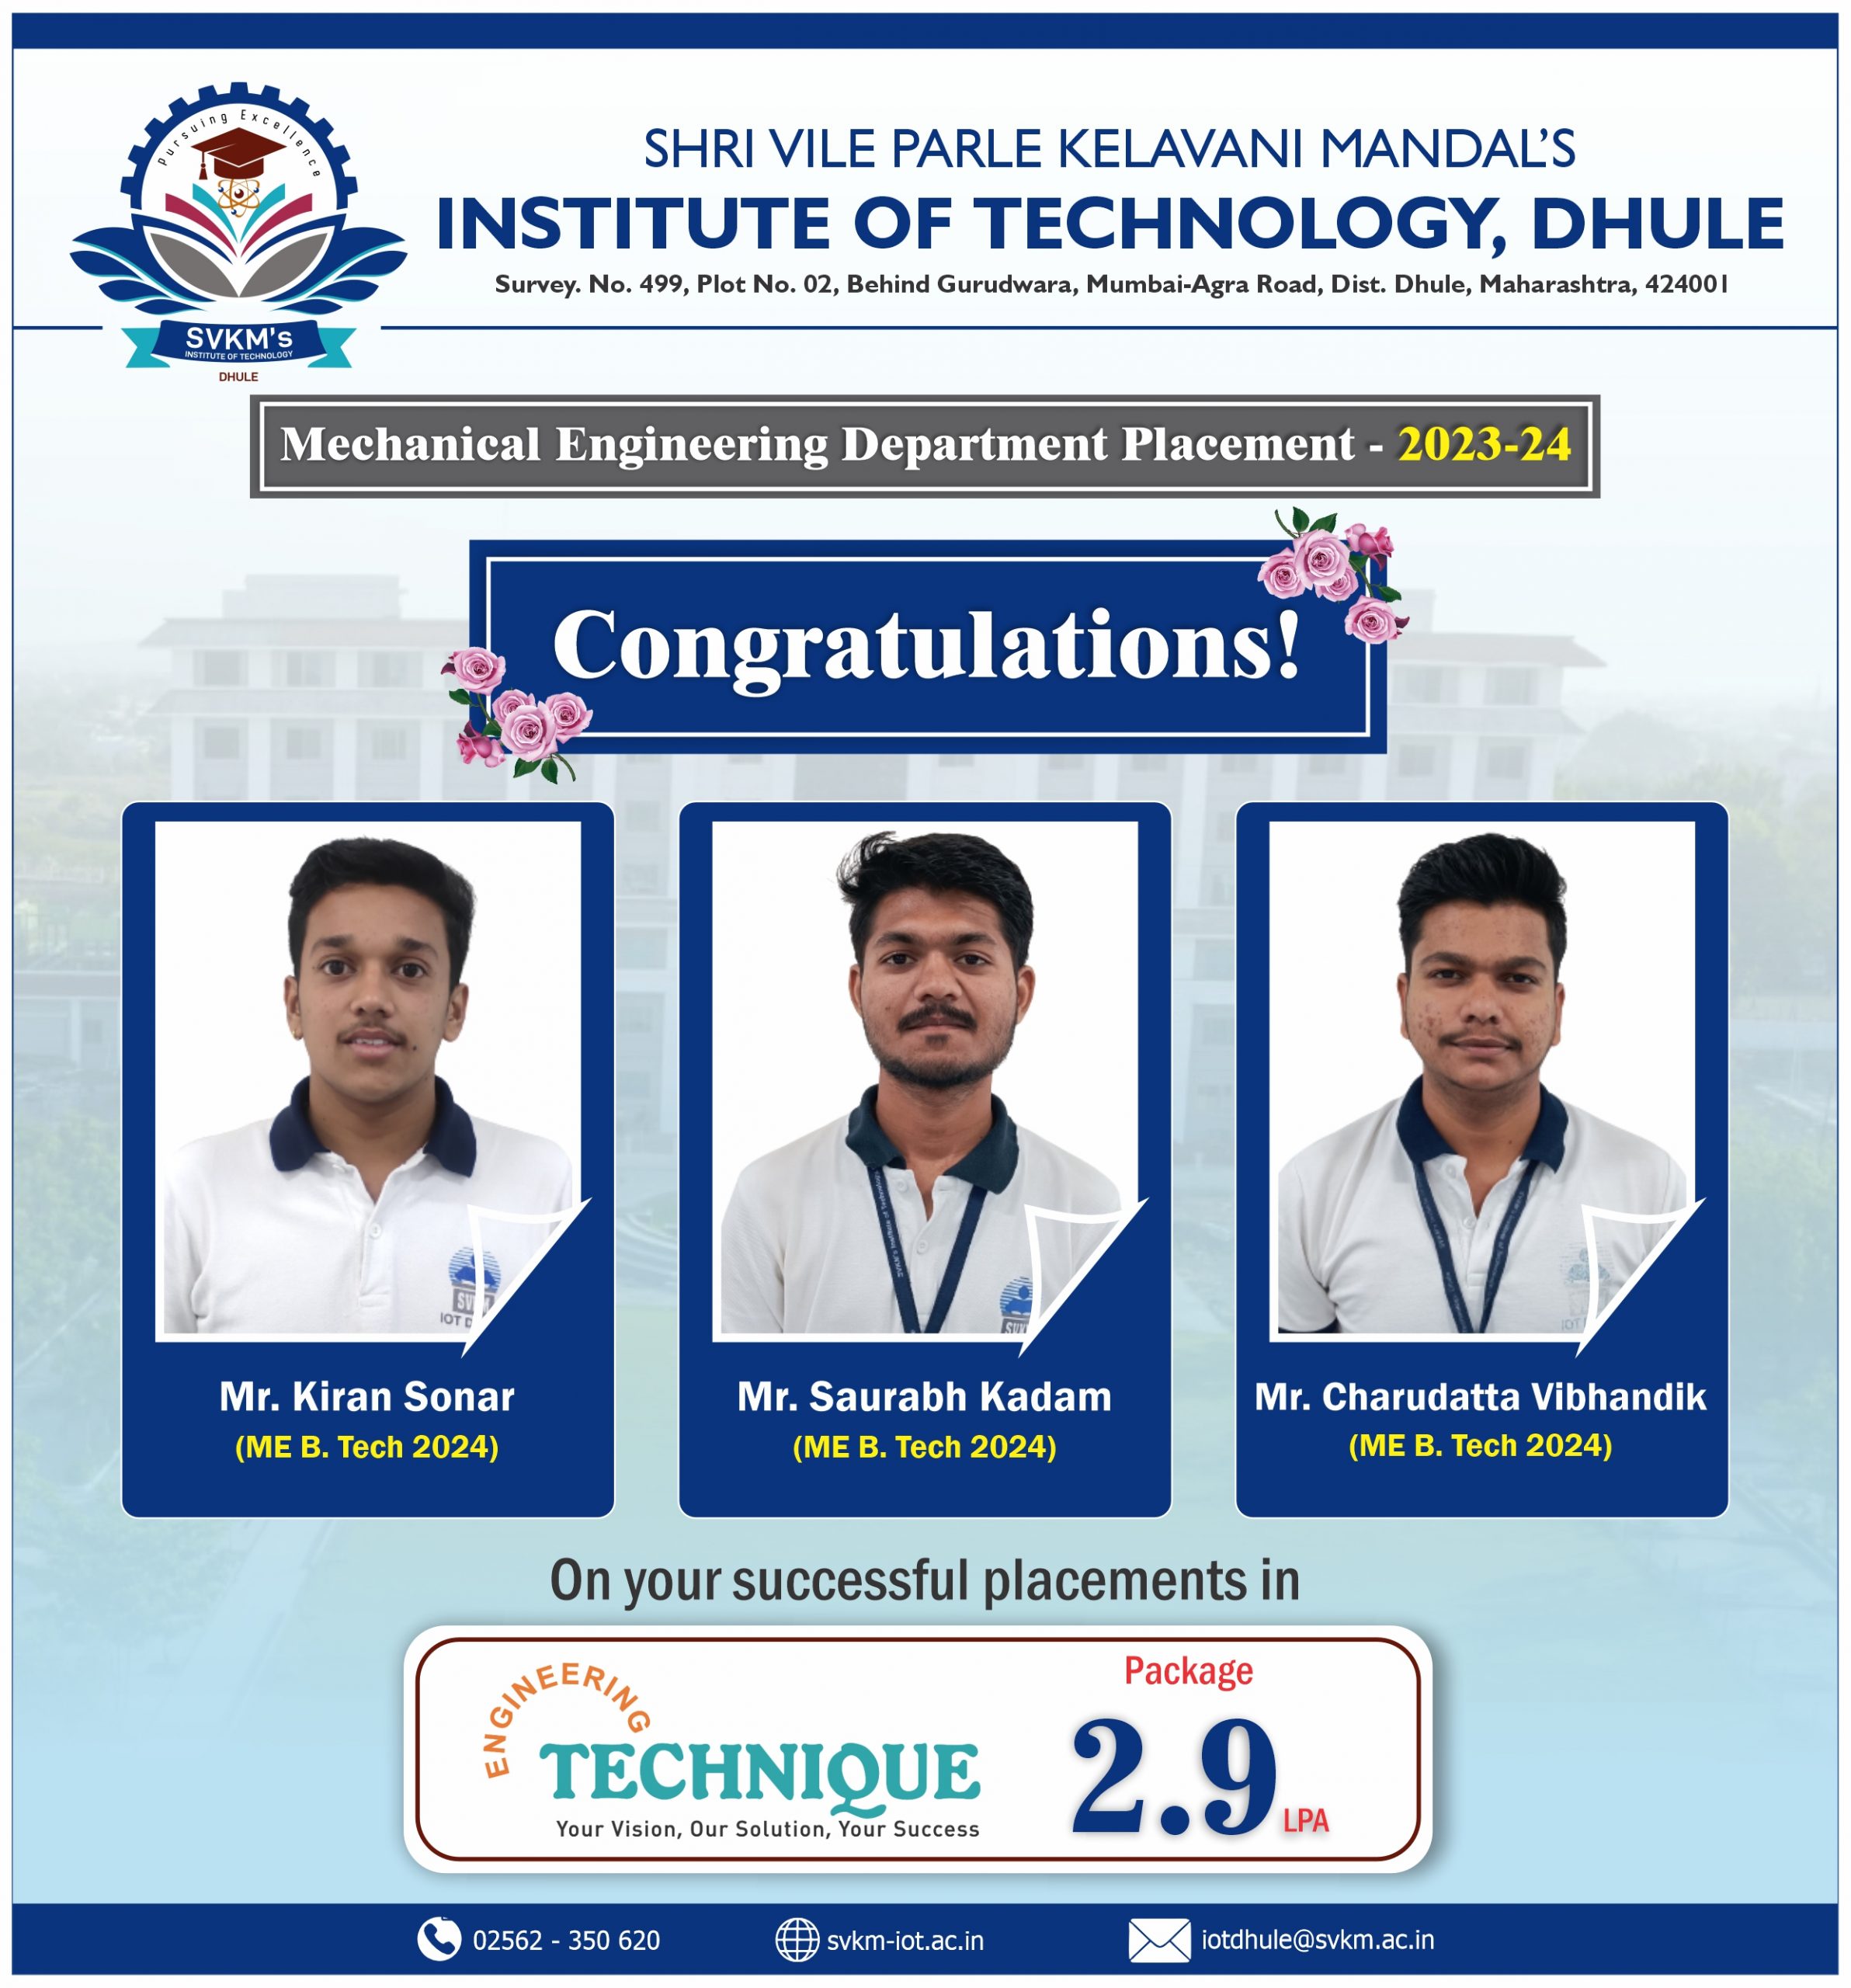
Mechanical Dept Placement Details_2023
Table of Placement numbers, quality, core hiring industry and pay packages
|
Year of Completion of Course |
Number of students placed
|
Minimum Salary (LPA) |
Maximum Salary (LPA) |
Average Salary of all the students placed (LPA)
|
|||
|
Total Number of Students graduated |
Placement Number |
Quality Placement |
Core Industry |
||||
|
2020-21 |
65 |
36 |
23 |
12 |
0.9 |
6 |
3.11 |
|
2021-22 |
72 |
49 |
33 |
14 |
1.2 |
6.25 |
2.88 |
|
2022-23 |
51 |
28 |
17 |
25 |
0.84 |
6 |
3.46 |


Staff Achievements
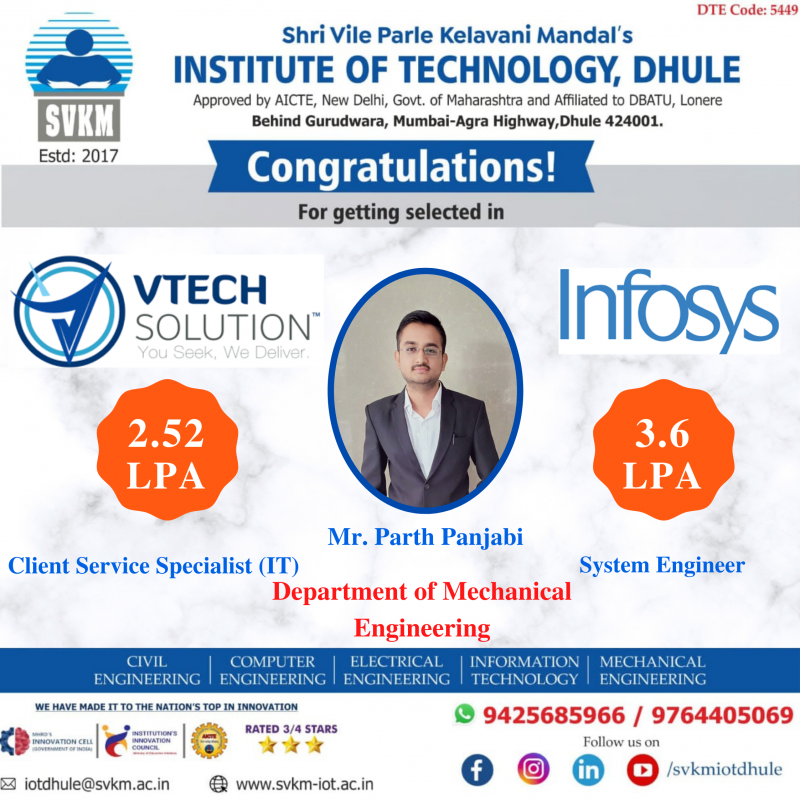
Student Placements
News & Events
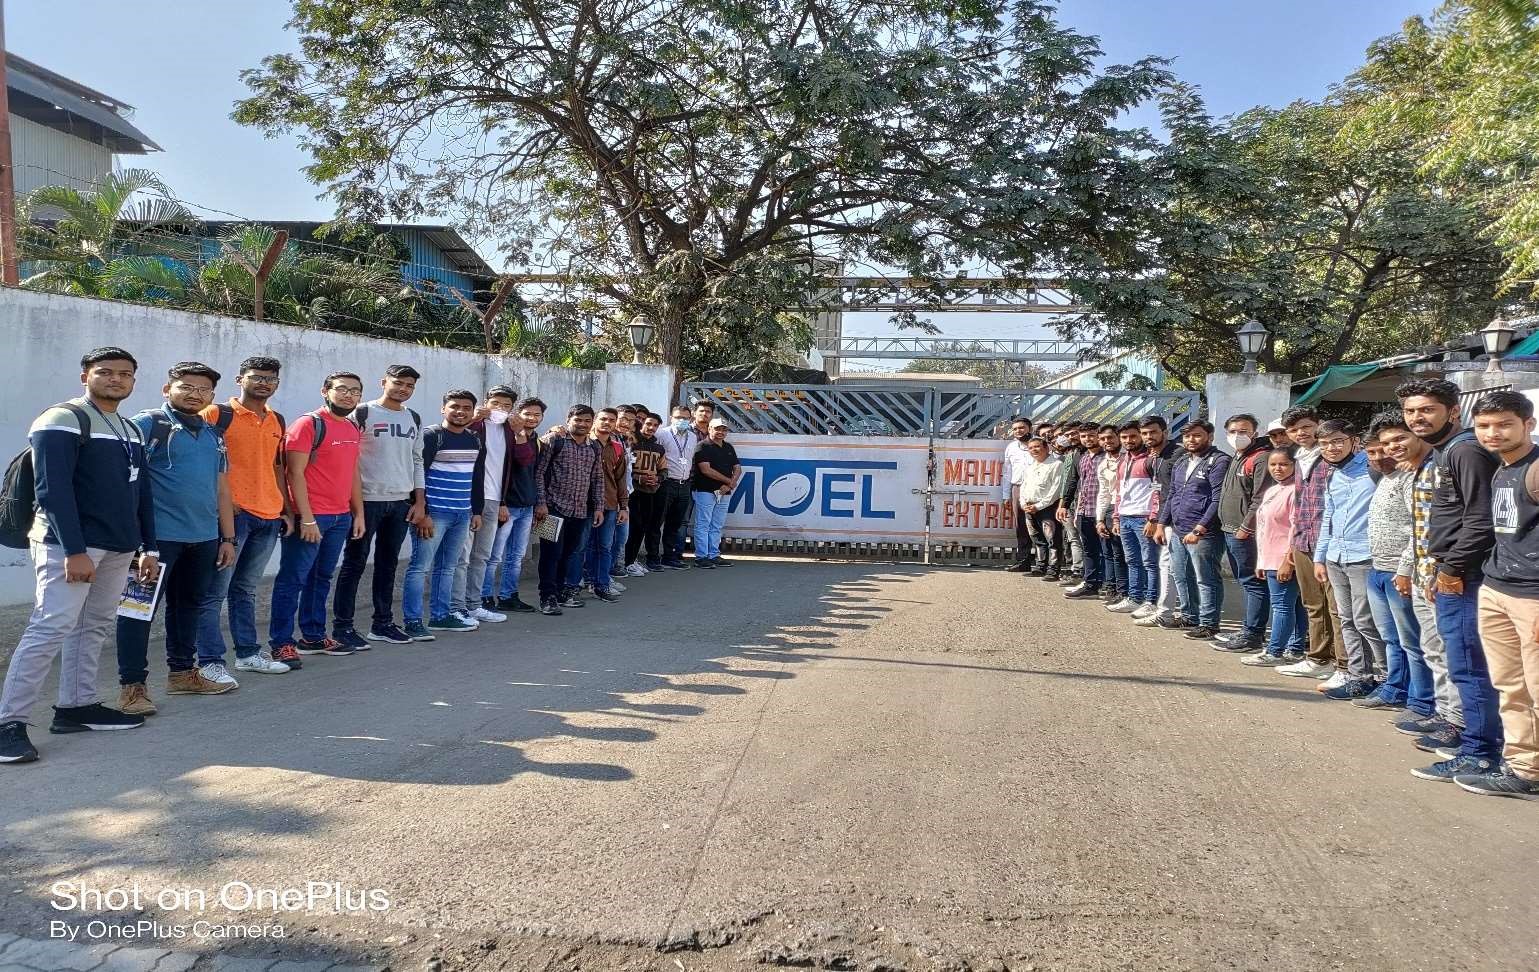
Industrial Visit
at Maharashtra Oil Extraction Ltd., Dhule